Classroom & live online 60 Hours Verifiable certificate Syllabus ↓

Power BI Course

Power BI course: get data, Power Query, data modelling, DAX, visuals, dashboards and sharing.

Your roadmap — from admission to certificate

  1. Free counselling

    Talk to our counsellor — choose the right course, batch time and mode.

  2. Admission

    Join at a CADD centre near you or online. You get your student login and ID card.

  3. Learn step by step

    60 Hours of hands-on Power BI classes — in the classroom or live online.

    Introduction to Power BIGetting DataPower Query: Cleaning and Shaping DataPower Query: Combining DataData ModellingDAX FundamentalsAdvanced DAX and Time IntelligenceVisualisation and Report DesignInteractive ReportsPower BI Service: Publish and Share
  4. Practice & project

    Exercises in every class and a final project, checked by your trainer.

  5. Course completion certificate + completion badge

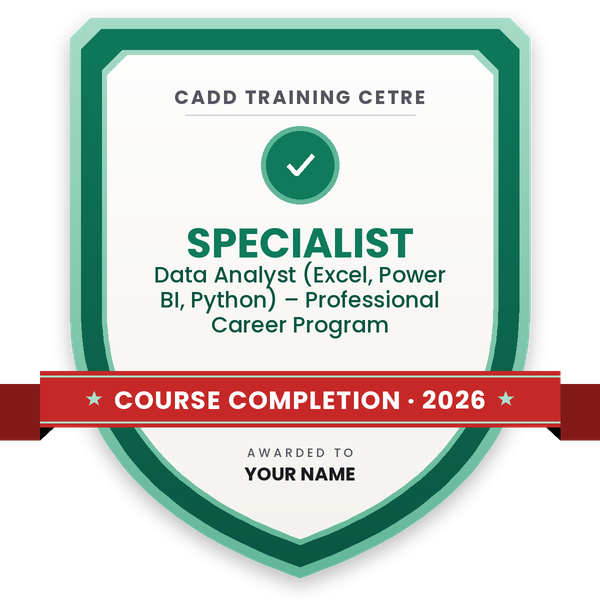
    Finish the course and get your course-completion certificate and a digital completion badge with your name.
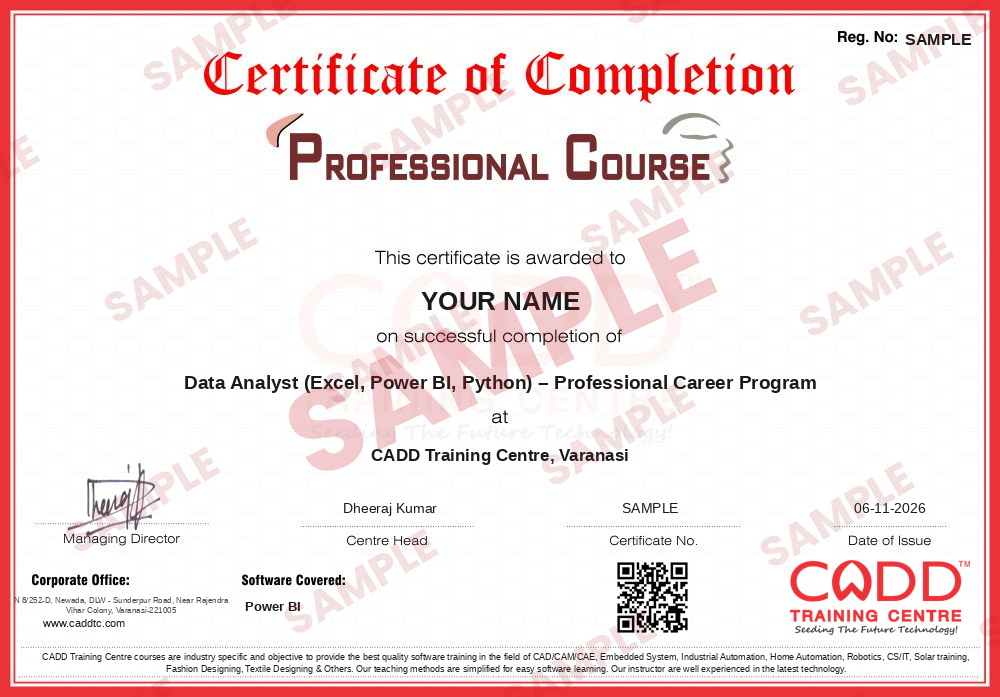
    Sample course-completion certificate — Data Analyst (Excel, Power BI, Python) – Professional Career Program
    Course-completion certificate (sample) — Data Analyst (Excel, Power BI, Python) – Professional Career Program · verifiable online
    Course-completion badge — Data Analyst (Excel, Power BI, Python) – Professional Career Program
    Course-completion badge
    Course
    Data Analyst (Excel, Power BI, Python) – Professional Career Program
    Issued by
    CADD Training Cetre
    Training
    Classroom or live online
    How to earn
    Complete the course and its project
    With your name and year · its own verify link · “Add to profile” on LinkedIn
  6. Certification exam

    Take the certification exam: a theory test and a practical task — at the centre or online.

  7. Certified certificate + marksheet

    Pass the exam and get the certified certificate with your marksheet. Anyone can check it online with its QR code.

  8. Certified badge

    Your certified badge — add it to LinkedIn and share it anywhere; it opens its own verify page.
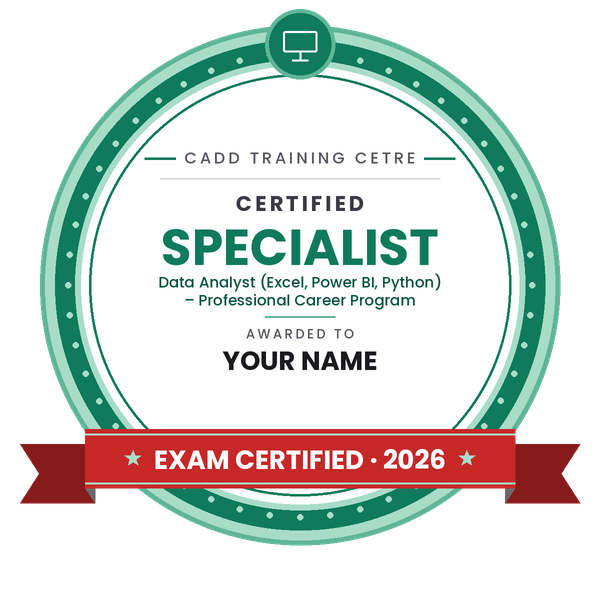
    Certified badge — Data Analyst (Excel, Power BI, Python) – Professional Career Program
    Certified badge
    Course
    Data Analyst (Excel, Power BI, Python) – Professional Career Program
    Issued by
    CADD Training Cetre
    Training
    Classroom or live online
    How to earn
    Pass the certification exam
    You also get
    Certified certificate + marksheet
    With your name and year · its own verify link · “Add to profile” on LinkedIn
  9. Make your CV & apply for jobs

    Make your CV in your student panel (Career → My CV) — your course, certificates and projects are added for you. Send it as a link with a preview picture, and apply to jobs and Hire Me requests from companies.

About the Power BI course

Microsoft Power BI is a business intelligence tool that turns raw data from Excel sheets, databases and online sources into interactive reports and dashboards. Managers use it to track sales, production, projects and finances in one place, and analysts use it to clean, model and explain data without writing large programs. Companies of all sizes, from manufacturers and retailers to banks and construction firms, use Power BI for everyday reporting.

This 60-hour course follows the real analyst workflow. You connect to Excel, CSV, folders, SQL Server and web sources, then clean and shape data in Power Query with steps such as removing columns, changing data types, splitting, merging, appending and unpivoting. You build a data model with fact and dimension tables, relationships and a date table, and write DAX measures with CALCULATE, filter functions, iterators and time intelligence. You then design report pages with charts, tables, matrices, maps, slicers, drill-through, bookmarks and tooltips, and finish by publishing to the Power BI Service, creating dashboards, setting scheduled refresh and row-level security, and sharing work through workspaces and apps.

The syllabus follows the skills measured in the Microsoft Certified: Power BI Data Analyst Associate (PL-300) exam, which you can book separately with Microsoft. Classes run in the classroom at CADD centres or in live online classes, and the centre provides the software for practice. After the internal assessment you receive a CADD Training Centre certificate that can be verified online.

The skills support roles such as Power BI developer, data analyst and MIS executive. Many learners also study advanced Excel or SQL alongside.

You will be able to

  • Connect Power BI Desktop to Excel, CSV, folder, database and web data sources
  • Clean, shape and combine data in Power Query
  • Build a star schema data model with relationships and a date table
  • Write DAX calculated columns and measures, including CALCULATE and time intelligence
  • Design interactive report pages with visuals, slicers, drill-through and bookmarks
  • Publish reports, build dashboards and set refresh and row-level security in the Power BI Service
  • Prepare for the Microsoft PL-300 Power BI Data Analyst exam

Who it is for

  • Graduates and students from commerce, management, engineering and IT
  • Excel users and MIS executives who prepare regular reports
  • Working professionals in sales, finance, HR, operations and projects
  • Learners preparing for the Microsoft PL-300 exam

What you need

  • Good working knowledge of Microsoft Excel
  • Basic understanding of tables, rows and columns
  • For live online classes: a Windows PC with 8 GB RAM and Power BI Desktop installed

Courses that include Power BI

Data Analyst (Excel, Power BI, Python) – Professional Career ProgramProfessional Career Program · 192 Hours · 5 software
Enquire →
GIS Analyst – Professional Career ProgramProfessional Career Program · 490 Hours · 6 software
Enquire →

Power BI Syllabus

12 chapters · 67 topics
01 Introduction to Power BI 5 topics
  1. What business intelligence is and where Power BI fits
  2. Power BI Desktop, Service and Mobile
  3. Power BI Desktop interface: report, table and model views
  4. The analyst workflow from data to dashboard
  5. Building a first quick report
02 Getting Data 6 topics
  1. Connecting to Excel and CSV files
  2. Importing a folder of files
  3. Connecting to SQL Server and other databases
  4. Web and online data sources
  5. Import versus DirectQuery modes
  6. Data source settings and privacy levels
03 Power Query: Cleaning and Shaping Data 6 topics
  1. Power Query Editor and applied steps
  2. Data types, removing rows and columns
  3. Split, replace, trim and format
  4. Pivot and unpivot
  5. Conditional and custom columns
  6. Column quality and data profiling
04 Power Query: Combining Data 5 topics
  1. Append queries
  2. Merge queries and join types
  3. Grouping and summarising
  4. Parameters and reusable queries
  5. Introduction to the M language
05 Data Modelling 6 topics
  1. Fact and dimension tables
  2. Star schema design
  3. Relationships, cardinality and cross-filter direction
  4. Creating a date table
  5. Hierarchies and sort by column
  6. Hiding fields and organising the model
06 DAX Fundamentals 6 topics
  1. Calculated columns versus measures
  2. SUM, AVERAGE, COUNT and DISTINCTCOUNT
  3. Row context and filter context
  4. CALCULATE with filters
  5. FILTER, ALL and REMOVEFILTERS
  6. Variables in DAX
07 Advanced DAX and Time Intelligence 6 topics
  1. Iterators: SUMX and AVERAGEX
  2. TOTALYTD, DATESYTD and SAMEPERIODLASTYEAR
  3. Month-on-month and year-on-year growth
  4. RANKX and Top N analysis
  5. DIVIDE and error handling
  6. Quick measures
08 Visualisation and Report Design 6 topics
  1. Bar, line, area, pie and combo charts
  2. Cards, tables and matrices
  3. Maps and geographic data
  4. Slicers, filters and the filter pane
  5. Conditional formatting and themes
  6. Report layout and design principles
09 Interactive Reports 5 topics
  1. Drill-down and drill-through
  2. Bookmarks and buttons for navigation
  3. Report page tooltips
  4. Edit interactions between visuals
  5. Mobile layout
10 Power BI Service: Publish and Share 6 topics
  1. Publishing reports to a workspace
  2. Creating dashboards and pinning visuals
  3. Workspaces, roles and apps
  4. Scheduled refresh and the on-premises data gateway
  5. Row-level security
  6. Sharing, exporting and subscriptions
11 PL-300 Exam Preparation 5 topics
  1. PL-300 skills outline and question types
  2. Review of prepare, model, visualise and manage tasks
  3. Practice questions and case studies
  4. Time management for case-study questions
  5. Microsoft Learn resources and exam booking process
12 Power BI Dashboard Project 5 topics
  1. Project brief: sales, project or production dataset
  2. Data cleaning and modelling
  3. DAX measures for key business figures
  4. Multi-page interactive report
  5. Publishing and dashboard presentation

Ratings & reviews

Students rate the course after they finish it — their ratings appear here.

Power BI course — FAQ

What is Power BI used for?

Power BI is used to collect data from many sources, clean it, build calculations and present the results as interactive reports and dashboards that can be shared across a team or company.

Who can join the Power BI course?

Students and professionals from commerce, management, engineering or IT can join. Good Excel skills are the most useful starting point; programming knowledge is not required.

How long is the Power BI course?

The Power BI course is 60 hours long, covering Power Query, data modelling, DAX, visuals, the Power BI Service, PL-300 exam preparation and a dashboard project.

Can I learn Power BI online?

Yes. You can join classroom batches at CADD centres or live online classes. Power BI Desktop is free for Windows, and the centre provides the software and sample data for practice.

Does this course prepare me for the PL-300 exam?

Yes. The syllabus follows the skills measured in the Microsoft Certified: Power BI Data Analyst Associate (PL-300) exam. The exam itself is booked separately with Microsoft, and you also receive a CADD Training Centre certificate after the internal assessment.

What is DAX in Power BI?

DAX (Data Analysis Expressions) is the formula language of Power BI. It is used to write measures and calculated columns, such as totals, percentages, growth over last year and running totals.

More questions? Ask our counsellor or read the general FAQ.

Power BI60 Hours
Enquire now